Standards Covered
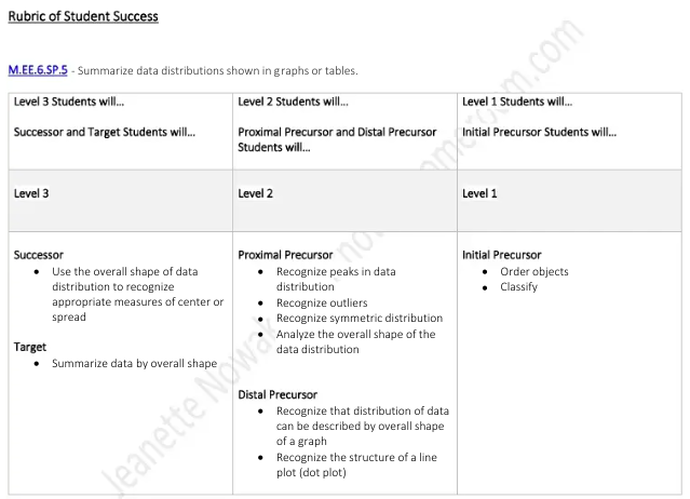
- M.EE.6.SP.5 - Summarize data distributions shown in graphs or tables.
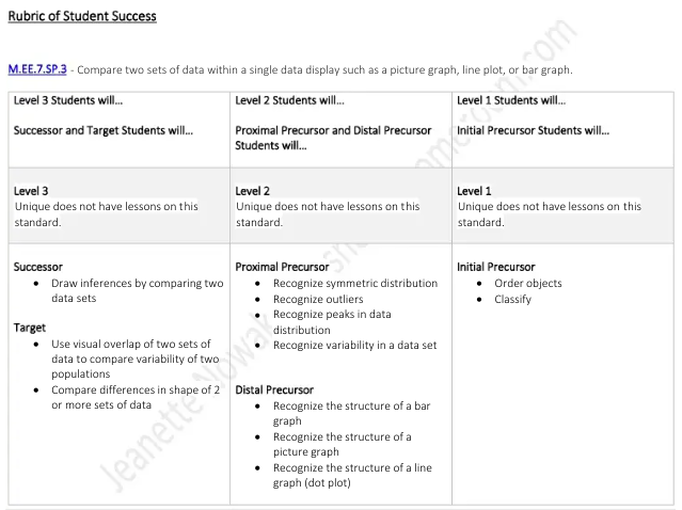
- M.EE.7.SP.3 - Compare two sets of data within a single data display such as a picture graph, line plot, or bar graph.
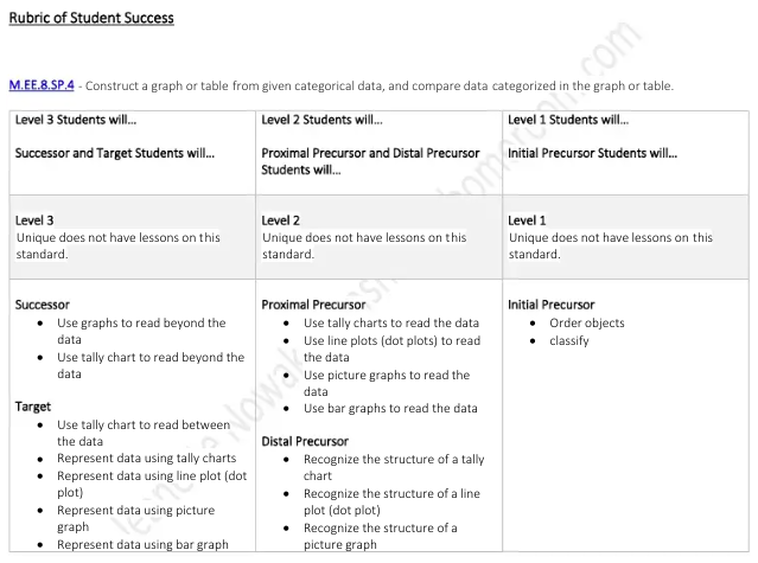
- M.EE.8.SP.4 - Construct a graph or table from given categorical data, and compare data categorized in the graph or table.
In the context of data analysis, graphs are an important component. Understanding graphs bridges the gap between perceptual and conceptual math. Graphs help students see the relationship between varying amounts and numbers. In early processes, students learn to gather data and represent this data on graphs. Students can answer questions when analyzing the data on the graphs. There are multiple real-world situations that require data analysis.
Data involves a variety of problem-solving processes:
Don’t forget the starter phrase:
Instructional Guides Mathematics Guide
These data gathering processes continue onto activities for statistics and probability.
Data involves a variety of problem-solving processes:
- What do we want to learn? What question could we ask?
- Many students eat in the cafeteria. What do we want to know?
- Questions might include: How many students eat the cafeteria meal versus packing a lunch?
- How many students like white or chocolate milk?
- What is the favorite food from the cafeteria?
- How will we gather the information we want to learn?
- Students ask or survey others with questions.
- Students work on skills to record information.
- Students need practice in asking questions to gather data.
Don’t forget the starter phrase:
- Excuse me. I am taking a survey. Would you mind answering a question about the cafeteria? (Pause for response.)
- What is your favorite food in the cafeteria?
- Students with limited verbal abilities may use a voice output device to ask questions.
Instructional Guides Mathematics Guide
- How will students record the answers to a question?
- This may include a tally sheet, a form to be completed by the person being surveyed, or by clipping clothespins on a response card.
- There are many adaptive ways for students to recognize skills in data recording.
- How will the data be displayed?
- Will the responses be put on a chart or a graph?
- Picture, words and coloring are all ways to display information.
- Data recording now becomes a counting process as well.
- A picture graph may be viewed to see “which column is the tallest?” But counting to get total numbers is also a way to begin to analyze the data.
- Which has more, less, is equal?
- These are all mathematics concepts that are now crossing between standards.
- What did we learn from this data?
- Every data gathering activity should have time for discussion and reflection on the results.
- Will there be a follow-up action as the result of the data learned?
- In the Middle School and High School grade bands, students begin to apply data that can be located in informational charts and graphs to formulate opinions and conclusions.
These data gathering processes continue onto activities for statistics and probability.
M.EE.6.SP.5 - Summarize data distributions shown in graphs or tables.
Learning Goal:
Essential Questions:
• What is the shape of the data?
• How is the data in this graph the same?
• How is the data in this graph different?
• Does this data have a pattern and if so, what is the pattern?
• How is this data distributed?
• How could I summarize my interpretation of the data?
Vocabulary:
• data – A collection of facts, such as numbers, words, measurements, observations or even just descriptions of things.
• graph – A diagram of values, usually shown as lines.
• pattern – Things arranged following a rule or rules.
• X axis - The line on a graph that runs horizontally (left-right) through zero.
• Y axis - The line on a graph that runs vertically (up-down) through zero.
• outlier - A value that "lies outside" (is much smaller or larger than) most of the other values in a set of data.
• compare – consider how things are the same.
• contrast – consider how things are different.
• organize – to arrange things based on a plan.
Learning Goal:
- Level 2-3 – Students will summarize data by overall shape.
- Level 1 – Students will order objects and classify.
Essential Questions:
• What is the shape of the data?
• How is the data in this graph the same?
• How is the data in this graph different?
• Does this data have a pattern and if so, what is the pattern?
• How is this data distributed?
• How could I summarize my interpretation of the data?
Vocabulary:
• data – A collection of facts, such as numbers, words, measurements, observations or even just descriptions of things.
• graph – A diagram of values, usually shown as lines.
• pattern – Things arranged following a rule or rules.
• X axis - The line on a graph that runs horizontally (left-right) through zero.
• Y axis - The line on a graph that runs vertically (up-down) through zero.
• outlier - A value that "lies outside" (is much smaller or larger than) most of the other values in a set of data.
• compare – consider how things are the same.
• contrast – consider how things are different.
• organize – to arrange things based on a plan.
M.EE.7.SP.3 - Compare two sets of data within a single data display such as a picture graph, line plot, or bar graph.
Learning Goal:
Essential Questions:
• What is this data telling me?
• What does this data represent?
• What comparisons or conclusions can you make from the data?
Vocabulary:
• data – A collection of facts, such as numbers, words, measurements, observations or even just descriptions of things.
• graph – A diagram of values, usually shown as lines.
• pattern – Things arranged following a rule or rules.
• X axis - The line on a graph that runs horizontally (left-right) through zero.
• Y axis - The line on a graph that runs vertically (up-down) through zero.
• outlier - A value that "lies outside" (is much smaller or larger than) most of the other values in a set of data.
• compare – consider how things are the same.
• contrast – consider how things are different.
• organize – to arrange things based on a plan.
Learning Goal:
- Level 2-3 – Students will use visual overlap of two sets of data to compare variability of two populations.
- Level 1 – Students will order objects.
Essential Questions:
• What is this data telling me?
• What does this data represent?
• What comparisons or conclusions can you make from the data?
Vocabulary:
• data – A collection of facts, such as numbers, words, measurements, observations or even just descriptions of things.
• graph – A diagram of values, usually shown as lines.
• pattern – Things arranged following a rule or rules.
• X axis - The line on a graph that runs horizontally (left-right) through zero.
• Y axis - The line on a graph that runs vertically (up-down) through zero.
• outlier - A value that "lies outside" (is much smaller or larger than) most of the other values in a set of data.
• compare – consider how things are the same.
• contrast – consider how things are different.
• organize – to arrange things based on a plan.
M.EE.8.SP.4 - Construct a graph or table from given categorical data, and compare data categorized in the graph or table.
Learning Goal:
Essential Questions:
• How can this data be displayed in a graph?
• How can this data be displayed in a table?
• What comparisons can be made from the data?
• How would I describe the comparison of the data?
Vocabulary:
• data – A collection of facts, such as numbers, words, measurements, observations or even just descriptions of things.
• graph – A diagram of values, usually shown as lines.
• pattern – Things arranged following a rule or rules.
• X axis - The line on a graph that runs horizontally (left-right) through zero.
• Y axis - The line on a graph that runs vertically (up-down) through zero.
• outlier - A value that "lies outside" (is much smaller or larger than) most of the other values in a set of data.
• compare – consider how things are the same.
• contrast – consider how things are different.
• organize – to arrange things based on a plan.
Learning Goal:
- Level 2-3 – Students will read and represent various types of graphs.
- Level 1 – Students will order objects.
Essential Questions:
• How can this data be displayed in a graph?
• How can this data be displayed in a table?
• What comparisons can be made from the data?
• How would I describe the comparison of the data?
Vocabulary:
• data – A collection of facts, such as numbers, words, measurements, observations or even just descriptions of things.
• graph – A diagram of values, usually shown as lines.
• pattern – Things arranged following a rule or rules.
• X axis - The line on a graph that runs horizontally (left-right) through zero.
• Y axis - The line on a graph that runs vertically (up-down) through zero.
• outlier - A value that "lies outside" (is much smaller or larger than) most of the other values in a set of data.
• compare – consider how things are the same.
• contrast – consider how things are different.
• organize – to arrange things based on a plan.


